
RSSBot
News Junkie
By Ash Jackson
This is the first installment of an exciting two-part series!
It all started with the grid, which was really an attempt to look at recruiting classes more objectively. With all of the recruiting coverage and discussion, the question was raised, "Does success beget success?" Specifically, "does a successful Win/Loss record lead to more successful recruiting for the following year?"
To answer the question I basically made another grid, but instead of offense/defense breakdown, I added our 11 former Big-12 brethren. Sadly, the numbers weren't very compelling in number-form, so I made them into a chart!
But I realized there was a problem: one year isn't good enough. So then I made another chart...
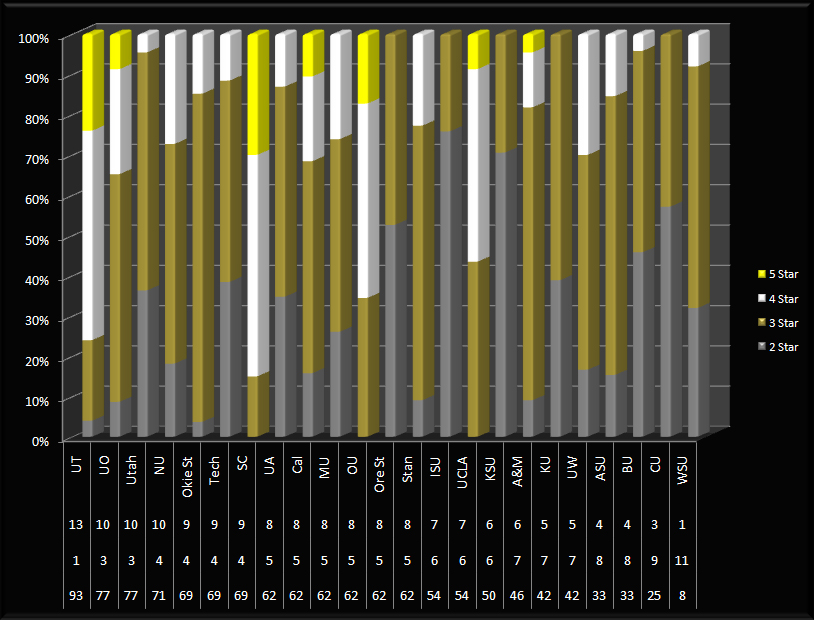
And that 'other' chart is what you see now: 2010 Recruiting Classes compared to 2009 Win/Loss record.
As you can see, the 23 teams are ordered by their winning percentage from the prior year (the bottom row of numbers) regardless of conference affiliation. Each team's record is shown as well, just below the team's name-label.

The colored bars show each team's recruiting class divided by percentages of star-ratings, relative to the whole, regardless of total size of the class. The raw numbers aren't shown (mostly for legibility) but it's enough to see that SC's class was +30% 5-star recruits, despite going 9-4 the prior fall; while Utah had a single lonely 4-star guy despite having 10 wins.
In addition to the comparison I listed above, some other fun things jumped out at me for the 2010 recruiting comparison:
What do y'all see in the chart that looks interesting, out of place, or fun?
Will Rocky be able to stop the hurtling aeroplane in time? Stay tuned for the exciting conclusion!
Originally posted by Ralphie Report
Click here to view the article.
This is the first installment of an exciting two-part series!
It all started with the grid, which was really an attempt to look at recruiting classes more objectively. With all of the recruiting coverage and discussion, the question was raised, "Does success beget success?" Specifically, "does a successful Win/Loss record lead to more successful recruiting for the following year?"
To answer the question I basically made another grid, but instead of offense/defense breakdown, I added our 11 former Big-12 brethren. Sadly, the numbers weren't very compelling in number-form, so I made them into a chart!
But I realized there was a problem: one year isn't good enough. So then I made another chart...
And that 'other' chart is what you see now: 2010 Recruiting Classes compared to 2009 Win/Loss record.
As you can see, the 23 teams are ordered by their winning percentage from the prior year (the bottom row of numbers) regardless of conference affiliation. Each team's record is shown as well, just below the team's name-label.
The colored bars show each team's recruiting class divided by percentages of star-ratings, relative to the whole, regardless of total size of the class. The raw numbers aren't shown (mostly for legibility) but it's enough to see that SC's class was +30% 5-star recruits, despite going 9-4 the prior fall; while Utah had a single lonely 4-star guy despite having 10 wins.
In addition to the comparison I listed above, some other fun things jumped out at me for the 2010 recruiting comparison:
- Any year Texas, Oklahoma or Southern Cal aren't playing for the national championship is an automatic failure. Seriously; they recruit so well anything less is reprehensible.
- CU's recruiting this particular year was abnormally bad, but still better than K-State or Iowa St. and on-par with new conference-mates Oregon St, Arizona, and Utah.
- Cal has had some mighty-fine recruiting classes, despite middling records and results.
- UCLA has NO BUSINESS being as bad as they are, and the next chart only reinforces this.
What do y'all see in the chart that looks interesting, out of place, or fun?
Will Rocky be able to stop the hurtling aeroplane in time? Stay tuned for the exciting conclusion!
Originally posted by Ralphie Report
Click here to view the article.